The policy illustration sitting in front of you looks impressive. Eight percent annual returns, tax-free retirement income, a death benefit your family keeps no matter what. What the illustration does not show you is what happens when the index stays flat for two years, or when the carrier quietly lowers its cap rate on your in-force policy next year.
Index universal life insurance is a legitimate financial tool. It is also one of the most frequently misunderstood products in the insurance industry and misunderstanding it at the point of purchase is a decision that takes decades to recover from.
What Is Index Universal Life Insurance and How Does It Actually Work?
Indexed universal life insurance is a permanent life insurance policy that will links the growth of your cash value to the performance of a stock market index. This growth is most commonly the S&P 500 while guaranteeing that you will never lose your cash value due to market losses. It is not a direct investment in the market. You do not own shares of anything.
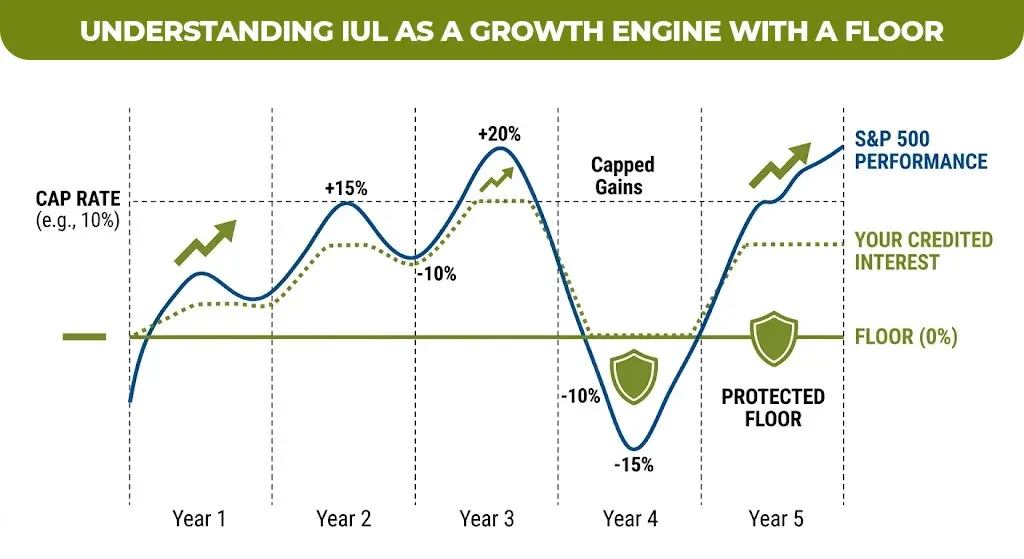
Here is the mechanics that most explanations rush past: the insurance company takes your premium, deducts the cost of your death benefit and internal policy fees, and credits the remaining cash value with interest based on how much the index gained during that period. If the index gained 14%, you receive credit up to your policy’s cap rate. In 2026, typical cap rates sit between 9% and 12% depending on the carrier and index strategy selected. If the index lost 20%, you receive 0% credit — meaning your cash value does not shrink due to market performance, but it also does not grow.
That floor is the important promise of an indexed universal life insurance policy. The cost of that floor is the cap on your gains during strong market years and the internal policy fees that apply regardless of market performance.
Index Universal Life Insurance Pros and Cons: The Full Picture
Most sales conversations emphasize the upside. Here is the full balance sheet.
| Feature | Advantage | Trade-off |
| 0% floor | Cash value protected from market losses | You give up large gains in strong years |
| Cap rate (9 to 12%) | Predictable maximum in any crediting period | Carrier can lower the cap on in-force policies |
| Flexible premiums | Adjust payments as income changes | Underfunding can cause policy lapse |
| Tax-deferred growth | Cash value grows without annual tax drag | Internal fees reduce effective return |
| Tax-free loans | Access cash value in retirement tax-free | Loans reduce death benefit if unpaid |
| Death benefit | Permanent coverage with no term expiration | Costs more than term and some whole life options |
| No direct market exposure | Insulation from volatility | Returns typically lower than direct index investing |
During the 2022 market downturn when the S&P 500 dropped 19.44%, then the IUL holders received a 0% credit rather than a loss as the floor functioned exactly as designed. The same policies also capped gains in 2023 and 2024 when the index recovered sharply.
The most important and underreported risk: carriers retain the right to lower cap rates on existing in-force policies. A policy illustrated at a 12% cap today can be adjusted to 8% or lower by your carrier in future years. Always ask your agent to show you what happens to your policy value if the cap rate drops by 3% over the life of the illustration.
Index Universal Life Insurance vs Whole Life: Which One Fits Your Situation
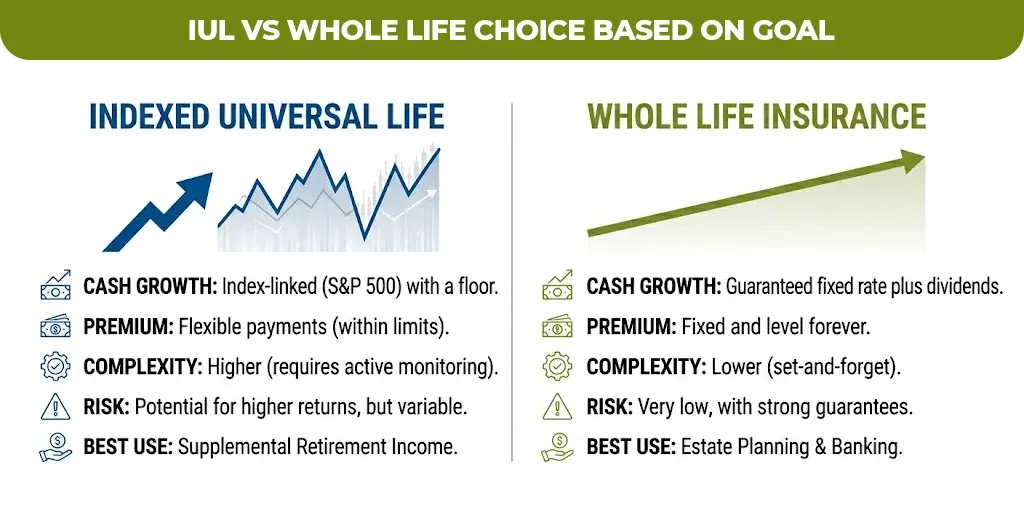
The choice between these two products comes down to one question: do you want the possibility of higher growth or the certainty of guaranteed growth?
| Feature | Index Universal Life Insurance | Whole Life Insurance |
| Cash value growth | Index-linked, variable (with floor) | Guaranteed fixed rate plus dividends |
| Premium flexibility | Flexible — you set the amount within limits | Fixed — same premium every year |
| Cost of insurance | Variable, increases with age | Level, built into fixed premium |
| Growth potential | Higher in strong markets | Lower but guaranteed |
| Policy lapse risk | Higher if underfunded | Very low with paid-up status |
| Best use case | Supplemental retirement income, tax diversification | Estate planning, banking strategies, conservative buyers |
| Complexity | High — requires active monitoring | Lower — set and predictable |
IUL typically excels for tax-free retirement income supplementation, market-linked growth with downside protection, and clients who have already maxed out their 401(k) and IRA contributions. Whole life performs better for clients who want guaranteed cash value accumulation or are using the policy as a banking vehicle.
In 2026, the 401k contribution limit is $23,500 ($31,000 if age 50 or older). IUL becomes most relevant as a supplemental vehicle once those tax-advantaged limits are reached, not as a replacement for them.
Index Universal Life Insurance Cost: What You Will Actually Pay
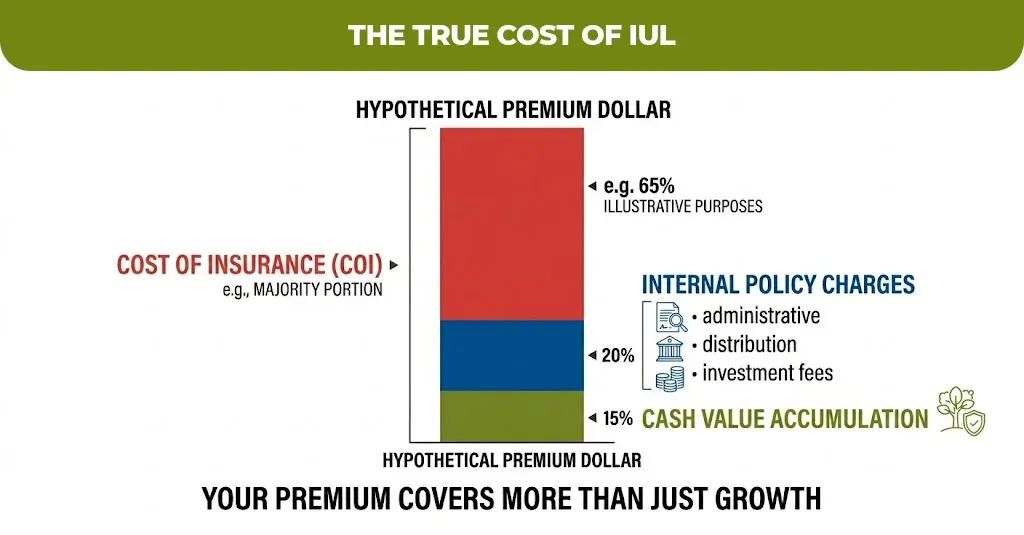
The premium alone does not tell you what an indexed universal life insurance policy costs. The real cost is the combination of three things: your cost of insurance, the internal policy charges, and the opportunity cost of gains capped below what the index itself earned.
The cost of insurance inside an IUL increases with age, which is why policies that are underfunded in early years can face dramatically higher internal charges in later years. A policy that looks financially sound at age 45 can lapse at age 70 if it was not funded adequately at the start.
Using an IUL Calculator: Why the Numbers Change Everything
An index universal life insurance calculator is not a prediction tool, it is a stress test. Use it as one.
A policy illustration showing 7% to 8% hypothetical annual returns is not guaranteed, it is a best-case projection under current cap rates, which the carrier can change. The illustration is built on an assumed average return, not a sequence of real market years.
In practice, two years of 0% crediting followed by one year at the cap produces a very different cash value than a steady 7% every year, even when the mathematical average is identical. This sequence-of-returns effect is what makes the illustrated rate a misleading benchmark.
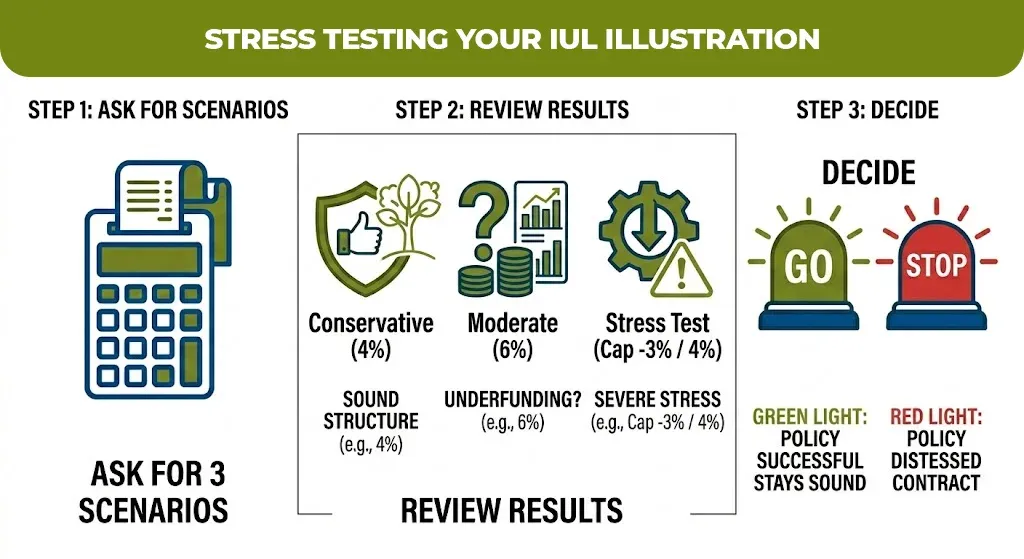
Before signing any policy, request that your agent run three scenarios through the illustration:
Current cap rates with a 4% average assumed return like the conservative projection.
Current cap rates with a 6% average assumed return like the moderate projection.
Cap rates reduced by 3% from their current level with a 4% average assumed return for the stress test scenario.
If the policy still accumulates meaningful cash value and does not lapse in the stress test scenario, the structure is sound. If it lapses or significantly underperforms in that scenario, the policy is underfunded relative to its internal costs.
Best Indexed Universal Life Insurance Companies in 2026
The best indexed universal life insurance companies are not necessarily those with the highest cap rates today. Cap rates are only one lever, carriers can lower them on in-force policies, and a company’s track record of treating existing policyholders fairly during adverse market conditions matters more than the opening offer.
The top IUL providers in 2026 include Prudential, Pacific Life, and Lincoln Financial for growth oriented policies, along with Protective Life for straightforward S&P 500 linked structures. National Life Group and Allianz Life are frequently cited for innovative index crediting strategies, including volatility-controlled indexes designed to smooth returns across market cycles.
When evaluating any carrier, ask four specific questions: What is the current cap rate on the S&P 500 strategy? What is the participation rate? What has the carrier done to cap rates on existing in-force policies over the past ten years? And what are the guaranteed minimum values if you assume 0% credited interest for the entire policy life?
Finding a Policy That Is Structured for You, Not Just Sold to You
The difference between an IUL that performs and one that underperforms is almost always in how the policy is designed at the beginning, the funding level, the death benefit structure, the rider selection, and the carrier’s track record on existing policyholders.
Mlife Insurance works with individuals evaluating indexed universal life insurance alongside their broader financial picture including existing retirement accounts, income goals, and time horizon to determine whether the product fits, what it should be structured to do, and which carrier delivers the most competitive combination of cap rates, financial strength, and policyholder-friendly history. If you are at the research stage, it is worth a conversation before any illustration is finalized.

Joyce Espinoza, Expert Life Insurance Agent
Joyce Espinoza is a trusted life insurance agent at mLifeInsurance.com. She’s been in the insurance industry for over ten years, helping people, especially those with special health conditions to find the right coverage. At MLife Insurance, Joyce writes easy-to-understand articles that help readers make smart choices about life insurance. Previously, she worked directly with clients at Mlife Insurance, advising nearly 3,000 of them on life insurance options.